Contact us
Discover how SAR data and space systems can help your organization achieve mission success. Reach out to our experts today.
In Post 1, we laid out the blind spots that exist even at well-run, billion-dollar mine sites. Fleet telemetry sees individual trucks. Shift reports summarize what happened yesterday. Nobody sees the whole system, continuously, from above.
Now for the technology that fills that gap — and specifically, the difference between taking pictures and building a time series. That difference changes everything.
Most Earth observation satellites image opportunistically. They pass over the same area, but from slightly different angles, at inconsistent intervals. Think of it like photographing a building from a different sidewalk each time — you can see it, but you can't precisely compare what changed between shots.
Ground Track Repeat — GTR — is different. It means the satellite returns to the exact same orbital path on a predictable daily cadence. Same geometry. Same viewing angle. Same radar illumination conditions. Every single day.
Why does that matter? You can only measure change reliably when you hold the observation conditions constant. When the viewing geometry shifts between passes, you're comparing apples to oranges. When it's held constant, you're comparing Tuesday to Wednesday — same vantage point, same physics, different ground truth.
Coherent change detection starts here.
Standard change detection compares brightness. Something got brighter or darker — maybe something moved, maybe the lighting changed, maybe a cloud cast a shadow. Useful but coarse.
Coherent change detection compares the phase of the radar signal. The difference between "something changed" and "this surface displaced 2.7mm in the line-of-sight direction between February 18 and February 20."
Think of it as the difference between noticing a door is open and measuring that a wall has shifted since last Tuesday. Millimeter-level precision from a satellite hundreds of kilometers above the Earth.
In the Atacama Desert, coherence is exceptionally high. Minimal vegetation means no leaves rustling between passes. Minimal moisture means the ground's dielectric properties stay stable. The very conditions that make the desert harsh for humans — no water, no greenery, relentless thermal cycling — make it ideal for radar.
We tasked the ICEYE US GTR constellation over the Mantoverde copper mine and collected a coherent time series across an eight-day window in February 2026. Here's what the data showed.

Figure 1 shows Multi-Temporal Coherence — MTC — visualizations of the open pit across two consecutive two-day windows. The color coding tells the story:
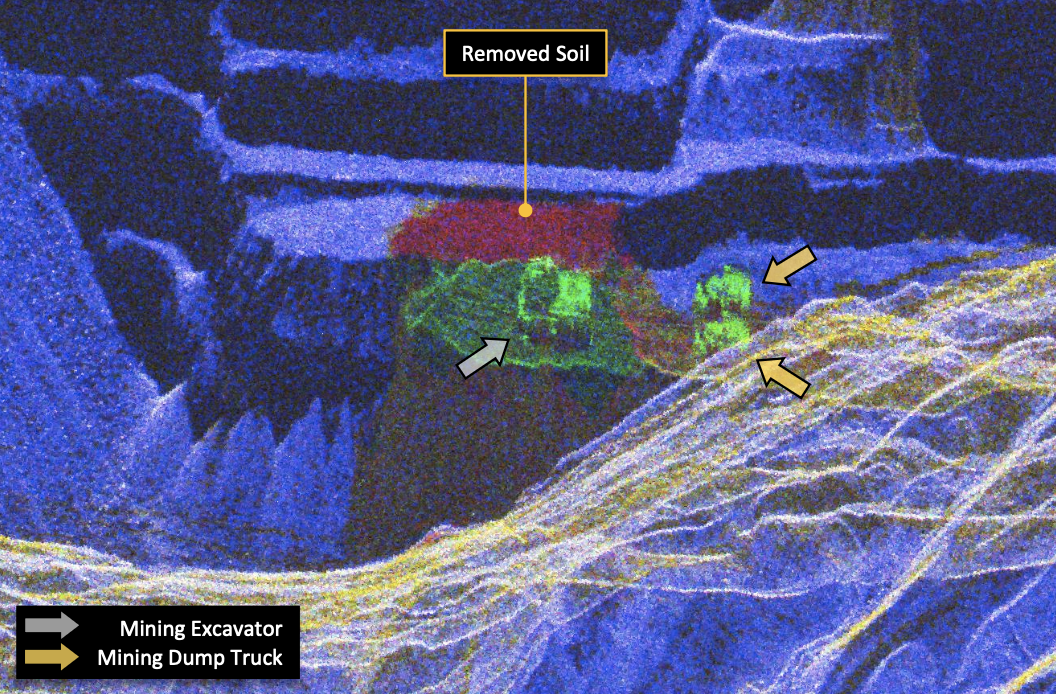
The red zones in Figure 1 are soil removal. You're watching excavation happen, measured from space, across 48-hour increments. The green signatures adjacent to haul routes are mining vehicles — dump trucks and excavators that moved position between passes.
Not interpretation. Measurement.

High-resolution SAR doesn't just detect that vehicles are present — it identifies what kind of equipment is operating. Figure 2 shows individual mining excavators and dump trucks resolved in the SAR imagery within the active extraction zone.
For operations monitoring, the implications are immediate. If you know what equipment is where and when, you can independently verify fleet deployment, estimate production rates, and detect anomalies — all without accessing the operator's fleet management system.
EXPLORE MORE
To understand how SAR tasking and data delivery work in practice — including daily-repeat collections like Mantoverde — read about the various ways ICEYE US delivers customer success.
Order SAR Data

Figure 3 shows the dynamic heap leach pad — the processing facility where copper ore is deposited, irrigated with acid solution, and then removed after the leachable copper has been extracted.
In the high-resolution SAR image, you can identify specialized equipment: grasshopper conveyors that shuttle ore along the pad, and radial stackers that deposit it in controlled layers. Identifying equipment at this scale, from space, through any weather conditions, at any time of day — that capability didn't exist at this resolution and cadence until GTR.
The three MTC panels below show the pad across three consecutive two-day windows. Watch the western (top) side of the pad: ore is being deposited in successive layers, visible as bright green returns. Now look at the eastern (bottom) side: a separate chain of grasshopper conveyors is removing spent ore. Deposition and extraction, operating simultaneously, monitored from orbit.
Operational tempo, made visible.

Figure 4 shows the spent ore dump — where processed material is deposited after leaching. The MTC overview reveals significant activity: changes in vehicle presence (annotated), surface disruptions, and new material deposition.
The three Coherent Change Detection — CCD — panels below tell a more precise story. CCD maps coherence directly: bright areas indicate high coherence (no change), dark areas indicate low coherence (high change). Across the three panels, you can see vehicle tracks appearing and disappearing, distinct areas where spent ore was added in stages, and the progression of dumping activity across the surface over the eight-day window.
The time series doesn't just show that the dump is active. It shows how it's being used — the pattern of deposition, the routes trucks take, the rate at which new material arrives. Trend data. The kind operators, regulators, and analysts actually need to make decisions.
A single SAR image answers: what is there?
A daily GTR time series answers: what is changing, at what rate, and is it anomalous?
Not an incremental improvement. A different category of information.
With a snapshot, you can confirm a mine exists and estimate its footprint. With a time series, you can measure extraction rates. You can detect when operations slow down or accelerate. You can watch ground surfaces deform before they fail. You can establish a baseline and then flag every deviation from it — automatically, continuously, without anyone on the ground lifting a finger.
The Mantoverde data set demonstrated this across every operational zone of the mine — open pit extraction, heap leach processing, and waste disposal — within a single eight-day collection window.
The technology works. The methodology is validated. The question now is: where else does this apply?
The answer, it turns out, is everywhere.
EXPLORE MORE
If you’d like to explore how daily-repeat SAR could be applied to one of your sites, reach our team via ICEYE US: https://iceye.us/contact-us